
What You'll Learn
- Why the S&P 500's 9-week win streak is the narrowest breadth rally in nearly three decades, with only ~4% of stocks hitting new highs alongside the index
- How the Magnificent 7's 38% weighting compares to entire national economies like Japan and Canada combined
- Why Michael Burry has expanded his Nvidia and Palantir put book to ~80% of his fund, betting roughly $1.1 billion against the AI trade
- What Bank of America's 7,100 price target, a 20% buyback collapse, and $370B in AI capex mean for the rest of 2026
- How concentrated rallies have historically ended in 1929, 1972, and 2000, and what makes this cycle look and feel different
The S&P 500 Just Made Its 9th Straight Weekly Gain — With Only a Handful of Stocks Participating
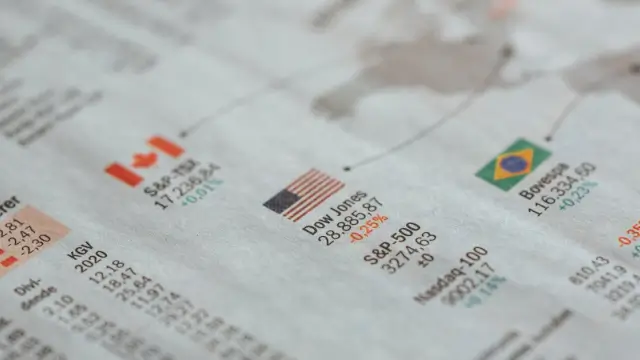
The S&P 500 closed at a record 7,599.96 on Monday, June 1, 2026, up 0.26% on the session and capping its ninth consecutive weekly advance, the longest such streak since 2023. The index is up 1.4% on the week and 5.0% month-to-date in May, according to Goldman Sachs positioning data, putting the broad benchmark within touching distance of the 7,700 handle that round-number traders have been watching since February.
But beneath that headline-grabbing green number sits a market that almost no one under the surface is actually participating in. Goldman Sachs strategists have called the current setup "one of the narrowest readings of market breadth in recent decades," with internal indicators flashing readings that match the late-1999 and 1972-style concentration episodes that preceded major drawdowns. Internal breadth data shows that only about 4% of S&P 500 constituents are simultaneously making new 52-week highs alongside the index itself, an extraordinary divergence between price and participation.
The advance-decline line, a classic breadth indicator that simply counts how many stocks are rising versus falling each session, has been printing bearish non-confirmations for most of 2026. Even the typically reliable equal-weight S&P 500 (ticker RSP) is lagging the cap-weighted index by an unusually wide margin, evidence that the rally is being driven almost entirely by the largest names rather than spreading organically through the economy.
This kind of divergence is not just an academic curiosity. Historically, when the index makes new highs but breadth collapses to single-digit participation, the next major leg lower tends to be sharp and unforgiving. The 1929, 1972, and 2000 peaks all featured this exact signature in their final months, and the current cycle is now echoing that pattern with uncomfortable precision.
Goldman's positioning data also shows hedge fund net exposure at multi-year highs, retail margin debt at record levels, and systematic CTAs chasing the trend. When the most crowded trade on Wall Street is "long the S&P 500," even a modest shock can force a violent unwind as margin calls trigger mechanical selling.
Magnificent 7 Now Equal 38% of the S&P 500 — The Size of Japan Plus Canada
The single biggest reason the S&P 500 can hit record highs while the median stock does almost nothing is the sheer gravitational pull of the Magnificent 7. As of May 2026, the seven mega-cap tech names — Nvidia, Microsoft, Apple, Alphabet, Amazon, Meta, and Tesla — collectively represent a record 38% of the S&P 500's total market capitalization, according to S&P Global and independent tracking by SlickCharts. That is the highest concentration the index has ever recorded, eclipsing the 1999-2000 dot-com peak.
To put 38% in perspective, the combined stock market capitalization of the Magnificent 7 is now roughly equal to the entire equity markets of Japan and Canada combined, plus a good chunk of the United Kingdom. A single basket of seven US-listed tech companies is now larger than the fourth- and fifth-largest national stock markets on Earth. That is not hyperbole; that is the math.
Inside that basket, the weight is even more concentrated than the headline number suggests. Nvidia alone has periodically traded above a 7% weight in the S&P 500, meaning that one chip designer can move the entire index by 7 basis points for every 1% it moves. Microsoft and Apple have each flirted with 7% weights in recent quarters. The top three names — Nvidia, Microsoft, and Apple — now represent roughly 22% of the index between them, a level of single-stock concentration that has no modern precedent.
When the top 10 stocks in an index represent a record share of total market cap, the index stops functioning as a diversified barometer of corporate America and starts functioning as a leveraged bet on a handful of growth narratives. Every passive fund that tracks the S&P 500 is, in effect, an unhedged long position on Nvidia, Microsoft, and Apple. Every 401(k) that holds an S&P 500 index fund is making a concentrated bet on AI infrastructure, cloud computing, and consumer hardware, whether the plan participant knows it or not.
This is what makes the current setup so fragile. A 10% drawdown in the Magnificent 7 would translate into a roughly 3.8% hit to the S&P 500 by market-cap math. A 20% drawdown would push the index into correction territory almost single-handedly. Diversification, the only free lunch in finance, has been quietly dismantled inside the most popular investment vehicle in the world.
Michael Burry's $1.1B Put War: Why the Big Short Investor Is Doubling Down
If there is one person on Wall Street with a track record of calling the end of a speculative cycle, it is Michael Burry. The investor who famously bet against the US housing market in 2007 and walked away with a fortune and a Hollywood movie has, by his own regulatory disclosures, placed a roughly $1.1 billion bet that the AI trade is about to break. And according to filings first reported in May 2026, he has not been reducing that wager; he has been aggressively expanding it.
Scion Asset Management, Burry's hedge fund, disclosed in its Q4 2025 13F filing on November 3, 2025 that it held put options on 5 million shares of Palantir Technologies (PLTR) and 1 million shares of Nvidia (NVDA). The Palantir position was valued at approximately $912 million and the Nvidia position at approximately $187 million, totaling roughly $1.1 billion in notional put exposure, an enormous wager for a fund of Scion's reported size.
But the more striking disclosure came in May 2026, when TradingKey and other outlets reported that Burry had expanded his short book to the point where the AI-related put options now represent as much as 80% of Scion's reported portfolio. That is not a hedged position. That is a thesis-sized, all-in bet that the AI infrastructure trade is in a bubble that will eventually deflate, with Burry publicly drawing explicit parallels to the dot-com era of 1999-2000.
In a now-deleted social media post that was widely circulated in May 2026, Burry argued that the "self-reinforcing AI narrative" is displacing fundamental analysis across institutional money management, with capital allocators paying premiums for revenue growth that may not materialize in line with consensus expectations. He singled out Palantir in particular as a stock trading at a multiple that assumes years of flawless execution and continued enterprise AI adoption acceleration, both of which he views as unrealistic assumptions.
The Burry bet matters for three reasons. First, his 2008 call was not a one-off lucky trade; it was the result of original fundamental research on subprime mortgage structures that almost no other investor was doing at the time. Second, his fund is now publicly disclosing these positions, which means he wants the market to know what he is betting on, the same way he did in 2007-2008. Third, the notional size relative to his reported AUM is so large that even a modest move in his favor could generate returns in the hundreds of percent for his fund, giving him asymmetric incentive to stay the course even if the timing proves painful in the short term.
Whether Burry is right this time, as he was in 2008, or wrong, as he was on a handful of his other high-conviction calls, his disclosure has become a focal point for the entire "is this an AI bubble" debate. Every quarterly 13F update from Scion is now parsed line by line by both Wall Street professionals and retail investors looking for signs that the Big Short is closing his positions or doubling down further.
The May 2026 disclosure that the put book has grown to 80% of portfolio suggests Burry himself believes the air pocket is closer than it has ever been, and that the trade he has been building for over a year is about to pay off.
BofA's 7,100 Air Pocket: Buybacks Down 20%, AI Capex Soaring to $370B
If Michael Burry represents the loudest voice warning about an AI bubble, Bank of America represents the most institutionally powerful one. In a surprise 2026 forecast published in December 2025, BofA's equity strategy team, led by Savita Subramanian, set a year-end 2026 S&P 500 price target of 7,100, the lowest on Wall Street at the time, implying roughly 4% upside from the levels the index was then trading at and roughly 7% downside from the June 2026 record of 7,599.
The 7,100 number is more than a price target. It is a framework for understanding why the most crowded long trade in years may be running out of fundamental support. BofA's three-pillar argument rests on reduced corporate buybacks, crushing AI capex commitments, and a shrinking Federal Reserve balance sheet, all of which are removing marginal buyers from the market just as the index attempts to push into uncharted territory.
On buybacks, the data is stark. S&P 500 companies repurchased $234.6 billion of their own stock in Q2 2025, down 20% from the $293 billion pace set in Q1, according to Goldman Sachs compilation of corporate treasury data. That is the largest sequential decline in buyback activity since 2018, and the trend has continued into 2026 as corporations redeploy free cash flow toward AI infrastructure rather than shareholder returns. With roughly $1 trillion in annual buybacks historically providing a structural bid under the S&P 500, a 20% reduction removes about $200 billion of buying pressure per year, an enormous headwind for an index that is already heavily reliant on passive and systematic flows.
On AI capex, the magnitudes are staggering. The seven largest US tech companies are on track to spend roughly $370 billion on AI infrastructure, including GPUs, data centers, and power generation, in 2026, a figure that has nearly doubled year-over-year. This capex is being funded out of operating cash flow, which means less is available for dividends and buybacks, and is also being financed in part by debt issuance, with several large-cap tech companies issuing multi-billion-dollar bond deals to fund their AI buildouts. The capex may eventually pay off in the form of AI-driven productivity gains, but in the near term it is a tax on shareholder returns and a source of execution risk if enterprise AI revenue fails to materialize on the timeline that bulls are pricing in.
On Fed liquidity, the picture is similarly unfavorable. The Federal Reserve's balance sheet has shrunk from a peak of roughly $9 trillion in 2022 to approximately $6.6 trillion as of May 2026, a $2.4 trillion withdrawal of liquidity from the financial system. Quantitative tightening has not yet ended, and even if the Fed pivots to rate cuts at the June 16-17 FOMC meeting, balance sheet policy tends to lag rate policy by several months. Less liquidity means less margin, less risk-taking, and less capacity for stretched valuations to expand further.
Put together, BofA's framework is essentially this: the buyback bid is fading, the AI capex tax is rising, and the Fed is no longer providing a tailwind. Against that backdrop, the "de-rating may be warranted in the months ahead" language in BofA's research note takes on real weight. A move from the current 7,599 level to BofA's 7,100 target would still leave the S&P 500 up year-to-date, but it would represent a meaningful psychological break and could trigger systematic selling that pushes the index well below 7,100 before the air pocket is fully expressed.
How a 4% Breadth Rally Holds Together — And How It Breaks
The mechanical question of the moment is how a market with only 4% breadth participation can keep grinding higher. The answer lies in the unique flow dynamics of the 2026 cycle, but the same dynamics also explain exactly how the rally could break.
On the supportive side, the rally is being held together by three forces. First, passive flows are relentless. Every paycheque that lands in a 401(k), every pension contribution that flows into an S&P 500 index fund, every ETF authorized participant creating new SPY shares, is buying the cap-weighted index regardless of which stocks are working. With trillions of dollars now indexed to the S&P 500, the daily mechanical bid is enormous and largely price-insensitive.
Second, corporate earnings for the Magnificent 7 have continued to surprise to the upside, justifying at least some of the multiple expansion. Nvidia's data center revenue, Microsoft's Azure growth, and Alphabet's cloud business have all posted quarters that exceeded the highest Wall Street estimates. As long as the underlying earnings power of the top names continues to grow, the index can keep making new highs even with terrible breadth.
Third, retail engagement has stayed high. The "meme stock" cohort that drove the 2020-2021 speculation has largely migrated into AI-themed names, and the zero-commission brokerage infrastructure built over the last decade means that retail capital can be deployed into crowded trades faster than ever. Options market activity, particularly in single-stock options on Nvidia, Tesla, and Palantir, has remained at historically elevated levels, providing a constant gamma tailwind for the underlying stocks.
On the breaking side, however, the same flows work in reverse. If passive flows ever turn into outflows (during a recession, a credit event, or a sentiment shock), the mechanical bid disappears and turns into a mechanical offer. If even one Magnificent 7 name misses earnings, the multiple compression can spread quickly through the AI complex because the entire investment thesis is predicated on continued, accelerating growth. And if options positioning becomes too one-sided, a delta-hedge unwind can amplify any decline by 2-3x as market makers sell to manage their exposure.
The historical base rate is also unfavorable. Of the eight times in the last century when the S&P 500 made new highs with breadth readings as narrow as today's, seven were followed by drawdowns of 10% or more within the following 12 months. The lone exception was a 2017 melt-up that was cut short by the early-2018 vol spike. Narrow breadth does not guarantee a crash, but it does guarantee that downside risks are elevated and that the index is more vulnerable than its headline level suggests.
Investors who are underweight the S&P 500 on the view that narrow breadth is unsustainable have largely been burned this year, but the underlying logic remains intact. The path to a sustainable bull market from here runs through earnings diffusion into the other 493 stocks in the index, and that diffusion has not yet begun.
What Investors Are Doing About It
Given the unusual setup, the institutional playbook has shifted meaningfully in 2026. According to BofA's monthly fund manager survey, cash levels across the world's largest active managers have risen to a multi-month high as portfolio managers take some chips off the table. Gold allocations have hit multi-year records. Defensive sectors like utilities, consumer staples, and healthcare have seen their largest inflows in over two years. And short interest in the most concentrated AI names has quietly risen to multi-year highs.
On the retail side, the playbook is more bifurcated. Some investors have moved into equal-weight S&P 500 ETFs (RSP) as a way to play the "broadening" trade that they believe is coming. Others have rotated into international developed markets, particularly Japan and Europe, where valuations are dramatically cheaper than US mega-cap tech. Still others have added to gold, silver, and Bitcoin as portfolio hedges against a possible drawdown scenario.
One popular trade is the "concentration unwind" pair trade: long the equal-weight S&P 500 and short the cap-weighted S&P 500. This trade profits if the gap between the two indices narrows, which can happen either through the Mag 7 falling or through the broader market catching up. The trade has struggled year-to-date in 2026 because the cap-weighted index has continued to outperform, but it remains a low-cost option on a broadening scenario.
Another popular approach is the "barbell" strategy: maintain a heavy allocation to high-quality cash-flowing businesses (the Mag 7 plus a few stable mid-caps) while pairing that with a meaningful allocation to deep-value, low-multiple names in sectors that have been left behind, including energy, materials, and small-cap industrials. This approach sacrifices some upside in a continued melt-up but provides significant protection if the concentrated leaders roll over.
For investors who do not have the time or inclination to manage these trades actively, the simplest and historically most effective response is rebalancing. Sell a portion of the S&P 500 winners, add to bonds, add to international, add to cash, and let the portfolio's natural diversification reassert itself. The investors who do best in concentrated markets are the ones who are most disciplined about rebalancing when the temptation to chase is highest.
Historical Precedents: 1929, 1972, 2000 — And Why 2026 Echoes All Three
Concentrated bull markets do not end gently. The three most relevant historical precedents, 1929, 1972, and 2000, all share a similar end-of-cycle signature: extreme index concentration in a small number of high-flying growth names, narrowing breadth, stretched valuations, and a public narrative that "this time is different" because some structural innovation (radio, the conglomerate, the internet, AI) is supposedly rewriting the rules of valuation.
The 1929 episode is the most dramatic. In the run-up to the October 1929 crash, the leading US industrials — the original Nifty 50, essentially, stocks like RCA and General Electric — represented an outsized share of total market cap. Breadth indicators had been deteriorating for months before the crash, and the few stocks that were making new highs were doing so on increasingly thin participation. The subsequent 89% drawdown over the following three years remains the worst in US market history.
The 1972 episode is more relevant for modern investors because it involved the "Nifty Fifty" — a group of high-quality growth stocks (IBM, Xerox, Polaroid, McDonald's, Coca-Cola) that institutional investors had agreed to pay any price for, on the theory that quality growth was a permanent feature of the market. Breadth had narrowed sharply in 1972 as the Nifty Fifty absorbed a growing share of capital flows, and the subsequent 1973-1974 bear market saw the average Nifty Fifty stock fall by roughly 60% from peak.
The 2000 episode is the most cited parallel for the current cycle. In early 2000, the top 10 Nasdaq stocks represented roughly 25% of the index's market cap, the highest concentration the exchange had ever seen. The "narrowing leadership" pattern that preceded the crash was nearly identical to what we are seeing today, and the subsequent 78% drawdown in the Nasdaq from peak to trough remains a cautionary tale for anyone who believes that a few great companies can hold up an entire market through a sentiment reversal.
2026 shares characteristics with all three episodes. The Magnificent 7's 38% weight exceeds the 2000 Nasdaq top 10 by a wide margin. The "AI is a new paradigm" narrative echoes the "internet changes everything" narrative of 1999. The buyback-fueled price action and the FOMO-driven retail engagement both have direct historical parallels. None of this means a crash is imminent, but the historical base rate for this kind of setup is decisively unfavorable, and prudent investors should at least be aware of the precedents they are walking into.
Conclusion
The S&P 500 is at all-time highs, but the rally is the narrowest in nearly three decades. The Magnificent 7 have absorbed so much of the index's market cap that the remaining 493 stocks barely move the needle. Michael Burry, the only investor with a recent track record of calling a major speculative top, has expanded his Nvidia and Palantir put book to roughly 80% of his fund, betting $1.1 billion that the AI trade is in a bubble. Bank of America, the most influential sell-side voice, has set a 7,100 year-end target, implying meaningful downside from current levels as buybacks collapse 20% and AI capex soars to $370 billion.
None of this guarantees an imminent crash. Breadth can remain narrow for months or even years before it eventually inflects. The Mag 7 can keep delivering earnings beats and pushing the index higher. The Fed can pivot dovish at the June 16-17 FOMC meeting and reignite the multiple expansion trade. But the underlying setup, narrow breadth, extreme concentration, peak liquidity withdrawal, and a credible bear thesis in the form of the Burry put book, is the most fragile in a generation.
For investors, the right response is neither panic nor complacency. It is awareness that the index you are holding is more leveraged to a handful of names than at any time in modern history, that historical base rates from 1929, 1972, and 2000 all point the same direction, and that the prudent path forward runs through rebalancing, diversification, and a clear-eyed view of the risks buried underneath the record highs.
Last Updated: June 02, 2026 | Source: S&P Global (Official Index Data) | Bank of America Securities (Sell-Side Research) | Morningstar / MarketWatch (Burry 13F Disclosure)